
By David Koch, CFP®, AIF®, CFA, Director of Portfolio Management/Senior Wealth Advisor
Originally Published September 6, 2017; Updated July 5, 2023
“Past Performance Is Not Indicative of Future Results” — Common investment disclosure based on SEC Rule 156
The statement above is embedded in the disclosure pages of nearly every financial instrument in the U.S. It is meant to prevent investors from chasing performance—that is, simply buying the investments that delivered the highest returns during the last period.
Don’t chase returns is sound advice. Buying the investment that most recently had the highest return is often a terrible strategy. And that’s how most investors, if they bother to read the above-quoted disclosure statement at all, interpret its language—as a warning.
But, and here’s the big reveal: “Past performance is not indicative of future results” is almost completely false. Past performance is (frequently) highly indicative of future results, but not in the way that many investors think.
A tangible example: Home prices
To illustrate my point, I’ll start with a thought experiment.
I’ll use a more tangible asset that more people are familiar with: their home. How long should it take the price of your home to double? According to U.S. Bureau of the Census, the median home price in the U.S. has increased an average of 5.5% per year since 1963. That would mean that, on average, the price of a home has doubled about every 13 years. Sounds reasonable, right?
If home prices are expected to double every 13 years and they go up 50% in year one, how does that change expectations for the next 12 years? You should adjust your expectations from a 5.5% average annual return down to about 2.4% for the remainder of those 13 years.
What if home prices go up another 33% in year two? If the long-term doubling rate were going to hold, the next 11 years would have a 0% expected return as the home’s price has already doubled. That doesn’t mean that prices won’t continue to move around in the interim, just that the price 11 years from now shouldn’t be expected to be considerably higher than it is already.
Now think about home prices going the other way. If a home’s price were to fall 50% in year one, how should that change your forward-looking expectation? You should expect a 12.2% average return for the next 12 years instead of 5.5%.
This is a simplified example, and there are thousands of nuances and exceptions: the home’s location, the cost of insurance, maintenance, and property tax to name a few. And keep in mind that if you’re living in your house and you have no desire to sell it, the market price should be nothing more to you than a curiosity.
The point I’m making is that there are long-term growth expectations around every investment, but prices fluctuate (sometimes wildly). Expectations should be adjusted following periods of large fluctuations.
Return expectations for equity investments
Most large financial institutions place long-term return expectations for asset classes and, while not exactly standardized, they are relatively stable over time. In 2010 for example, JP Morgan placed an expected return on U.S. large cap stocks of 7.75%—this was following an especially bad period. The firm’s 2017 expected return is now 1.5% lower, at 6.25%—following an especially good run in the U.S. market. Both predictions are close to 7%, but they were adjusted up after the financial crisis, and adjusted down following the recent run-up.
If there is a long-term expectation that the U.S. stock market will return 7% over the next 10 years, this is not equivalent to an expectation that the U.S. stock market would return exactly 7% each and every year. There will be fluctuations along the way, and again, those long-term expectations should be adjusted following periods of especially high or especially low returns.
Price matters
The return on an investment is a function of the price you pay for it, the price for which you ultimately sell it, and the cash flows it generates (or costs you) in between. Few investments allow the investor to have any control over the interim cash flows, but you do have control over when you buy and sell.
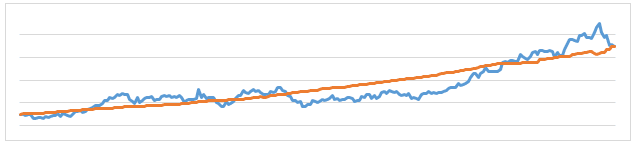
Look at the two return streams illustrated below. The time span is irrelevant; this could be 20 minutes, 20 days, 20 weeks, 20 months, or 20 years. These two investments started at the same price and diverged from there, but they ended up at the same price at the end. Interestingly, there were five moments when their prices touched. During these moments, returns on the two investments would have been the same.
If you bought blue at any time when blue was above orange, you would end up with a lower return than orange if you sold at the end. Likewise, any time you bought blue when it was below orange, you would have fared better if you sold it at the end point when both were the same price.
Past performance matters
The reality is that if an investment has done especially poorly in the recent past, because of its new, lower pricing, it may have a greater chance of doing especially well in the future—this is in order for it to “catch up” to where its long-term return is expected to be. We’ve discussed the ramifications of a 35 year bull market for bonds and 8 year bull market for stocks on our piece, “The Death of the 60/40.”
The process of catching up in either direction is called mean reversion, and it is ubiquitous. If an abnormally tall woman has a child it is likely that the child will be shorter than she. Still tall, sure, but closer to average. Likewise, if an investment has had an abnormally good run it is more likely than not to have an abnormally down period at some point that will bring it back to “normal.” There are always exceptions, and sometimes that period of adjustment happens when you least expect it, but adjust it will.
Disclosure:
This newsletter contains general information that is not suitable for everyone. The information contained herein should not be construed as personalized investment advice. Past performance is no guarantee of future results. There is no guarantee that the views and opinions expressed in this newsletter will come to pass. Investing in the stock market involves gains and losses and may not be suitable for all investors. Information presented herein is subject to change without notice and should not be considered as a solicitation to buy or sell any security.
Halbert Hargrove Global Advisors, LLC (“HH”) is an SEC registered investment adviser with its principal place of business in Long Beach, California. HH and its representatives are in compliance with the current registration and notice filing requirements imposed upon registered investment advisers by those states in which HH maintains clients. HH may only transact business in those states in which it is registered, notice filed, or qualifies for an exemption or exclusion from registration or notice filing requirements. This brochure is limited to the dissemination of general information pertaining to its investment advisory services. Any subsequent, direct communication by HH with a prospective client shall be conducted by a representative that is either registered or qualifies for an exemption or exclusion from registration in the state where the prospective client resides. For information pertaining to the registration status of HH, please contact HH or refer to the Investment Adviser Public Disclosure web site (www.adviserinfo.sec.gov).
For additional information about HH, including fees and services, send for our disclosure statement as set forth on Form ADV from HH using the contact information herein. Please read the disclosure statement carefully before you invest or send money.
