April 2017
In our first article in this three-part series, we introduced the personal funded ratio as an enhancement to the financial planning process. The personal funded ratio (PFR) is a robust measure that allows an advisor to quickly determine whether a client is on track to meet her goals, while also providing insights about the appropriate investment solutions for her. Its clarity and relative simplicity enable clients to easily grasp the sustainability of their retirement spending plans—which makes it a great communication tool as well.
In this article, we’ll provide more detail on why it is important to measure the funding level of a client’s financial plan, how to measure it, and how it correlates with Monte Carlo simulation results.
Injecting More Accuracy Into Retirement Planning
The most important characteristic of the personal funded ratio is that it takes account of both clients’ assets (resources) and liabilities (claims). Consider a retiring client who has $1 million saved and wants to spend $50,000 per year. Is this a sustainable plan? There are several conventional approaches to answering this question. Typically, planners will examine the chance of a client’s running out of money by a specific age—one that’s associated with a conservative estimate of life spans. A simple rule of thumb like the 4.5% rule or a more complex Monte Carlo simulation could be used.
Both of these approaches provide valuable perspective, but consider this: The 4.5% withdrawal rule is based on a history that differs substantially from the future we face; the results from Monte Carlo rely on assessments of future returns that are very uncertain; and the life spans of clients are unknown. Neither method assesses the cost of the desired spending in today’s market, whereas the PFR does. It also draws on valuations for immediate life annuities, which provide a market price for lifetime spending in the current market.
Computing the PFR: An example
Consider a hypothetical client named Lucy, a new retiree, age 66, looking to spend $50,000 a year in constant dollars from her accumulated assets. How do we accurately assess the cost of her future spending in today’s dollars?
Using the formula of actuarial net present value, we can value generic spending obligations that occur over Lucy’s lifetime. Importantly, actuarial net present value is consistent with how insurance companies price immediate life annuities: The value computed is consistent with market prices for lifetime income streams. Thus, future spending is discounted by a combination of risk-free rates and mortality assumptions as published by the Society of Actuaries.
In addition to valuing future spending, the planner who uses the personal funded ratio to assess Lucy’s retirement readiness will also need to value her resources to support spending. Assets that are currently held in her bank accounts, brokerage accounts, IRAs or 401(k) plans are easily valued and combined—although taxes, a liability, must be considered. Lucy’s future cash flows from Social Security can be valued using actuarial net present value, similar to essential and desired spending. Future cash flows that are more uncertain can be discounted by interest rate curves varying from Treasurys to “BBB” bonds of appropriate duration. If Lucy chooses to work part time in retirement, we can value her wages and include those as an asset.
Individuals still saving for retirement would also need to value future contributions. Employees typically receive regular salary payments throughout their working lives that tend to increase with inflation; this payment pattern is similar to an inflation-protected bond. Given this, we can value a client’s future percentage-of-salary contributions in the same way we would value an inflation-protected bond.
We can now calculate the funded ratio of Lucy’s plan by dividing the value of her resources by the value of her claims:
(Future Contributions + Investment Assets) / (Essential + Desired Spending Goals)
Since Lucy will have no further contributions, the value of her future contributions is zero. If the resulting ratio is positive, Lucy’s personal funded ratio is positive, and she is fully funded.
What It Means To Be Fully Funded
What does it mean for clients to be fully funded? In retirement, being fully funded means that a client can afford to buy her spending stream at current market prices from an insurance company. Insurance companies price annuities according to current interest rates and their tie to fixed-income investments that will support the obligation to meet the spending stream. Annuity prices factor in potential returns from the marketplace. We are not suggesting that clients purchase annuities to fund their spending.
However, we feel that it is important to preserve their option to do so, which means plans should be managed to a benchmark of at least 100% funding. This target also has the effect of grounding an investment plan in the client’s current starting investment conditions.
For clients still in their pre-retirement years, being fully funded means they can invest their wealth and future contributions in risk-free assets to meet their retirement goals. But achieving a fully funded status early in life is rare. Most clients don’t save enough to afford themselves a risk-free investment strategy over their entire accumulation life cycle. Usually, a client will have to accept equity risk to eventually become fully funded (unless she has saved an exceptional amount). However, by the time retirement is reached, the spending plan should be fully funded.
The PFR And Retirement Plan Success
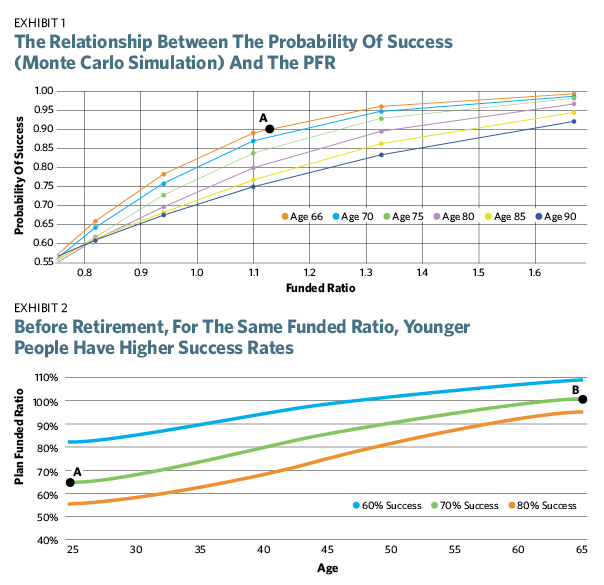
To draw a closer connection between the personal funded ratio and the typical Monte Carlo simulation approach, we’ve plotted the probability of success from a simulation against the initial funded ratio of a fairly generic plan as Exhibit 1. (Both Exhibits 1 and 2 and the supporting scenarios can be found in Sam Pittman’s article: “Use Your Client’s Funded Ratio to Simplify and Improve Retirement Planning Decisions,” from the Fall 2015 issue of The Journal of Retirement.) The portfolio used is one allocated to 40% equity and 60% fixed income, and the spending amount is constant in real terms, withdrawn annually at the end of each year.
We could simulate other portfolios too; the point here is to provide a sense of how the funded ratio relates to a suitable retirement portfolio. In this example, it is assumed that all wealth is invested and all spending comes from this wealth.
We note two interesting patterns. The first is that the probability of success and the PFR are positively related. Individuals who have more money to fund their spending stream are at lower risk of running out of money.
The probability of a 100% funded plan running out of money is in the range of 17% to 30%, depending on the person’s age. Investors who desire higher certainty should engage in spending plans that have a higher funded ratio. For example, investors early in retirement (age 66) can achieve a probability of success of approximately 90% by adopting a spending plan that has a funded ratio greater than 115% (see Point A). The second pattern revealed in Exhibit 1 is that the younger you are, the greater your probability of success for a given funded ratio. This occurs because there is more uncertainty in the relative life span for an older individual.
Exhibit 2 shows that before retirement for the same funded ratio, younger individuals have higher success rates. Someone who is one year from retirement and 70% funded must close a 30% funding gap in a single year. This would require a very large portfolio return. On the other hand, a younger person 30 years from retirement can close a 30% funding gap by investing a portion of her wealth in equity over multiple years. For example, to achieve a 70% chance of success, we can see that at the start of one’s career, the retirement plan should be nearly 65% funded (see Point A). And she should achieve a funded ratio of at least 100% (see Point B) by the time she reaches retirement.