
BY: Russ Hill, Chairman & CEO
What lower-return world?
The global synchrony of gains in 2017: Stocks were up around the globe as U.S., developed European, Japanese and emerging markets all gained in excess of 20%. Bonds were up. Gold was up. REITs were up. Small caps, mid caps, individual countries—you name it.
How do these returns rank from a historical perspective? Looking back at index performance for the S&P 500, MSCI Europe and MSCI Pacific since 1970, prior to 2017, there had only been five years when all were up 20% or more: 1975, 1983, 1985, 2003 & 2009. 2017 made it six.
In the U.S., the broad stock market ended 2017 with a Sharpe ratio of 3.4.
Unusual? Extraordinary is a better term.
The widely used Sharpe ratio is a measure of risk-adjusted returns. This measure subtracts the risk-free rate from the average return and divides that by the standard deviation of that return. When risk-free rates and volatility are very low, and returns are high, 2017’s 3.4 is the result. Compared with the long-term average Sharpe ratio of .5 for the U.S., that’s about seven times better. On a 35-Trillion-Dollar asset class, one might be tempted to say it would be impossible—if it had not occurred.
THE SUBJECTIVITY—AND IMPRECISION—OF FORECASTING
We’ve gone from forecasts of disaster with the Trump election victory in the U.S. and various anti-globalization political landmarks to a terrific financial-markets year globally.
Remember Mark Cuban (Dallas Mavericks/Shark Tank)? Around election time in 2016, we heard him comment:
In the event Donald wins, I have no doubt in my mind the market tanks. If the polls look like there’s a decent chance that Donald could win, I’ll put a huge hedge on that’s over 100% of my equity positions…that protects me just in case he wins.
Remember Paul Krugman, the extremely liberal Nobel Laureate turned talking head for The New York Times? Following the November 2016 election, he pontificated:
It really does look like President Donald J. Trump, and markets are plunging. When might we expect them to recover?
Frankly, I find it hard to care much, even though this is my specialty. The disaster for America and the world has so many aspects that the economic ramifications are way down my list of things to fear.
Still, I guess people want an answer: If the question is when markets will recover, a first-pass answer is never.
Krugman later apologized for letting his political feelings distort his economic judgment; all too human—most of us do this much of the time.
Cuban and Krugman had a good deal of company: Goldman Sachs expected a rousing 1% gain in the S&P 500 for 2017. Merrill Lynch expected higher inflation, real assets to beat financial assets, and a 5% increase in the broad market for the year.
Of course, on the other side was the so-called “Trump Trade” where new policies and lower taxes were going to lead to ever more prosperity.
And how can we explain the global—not just U.S.—growth in markets in the face of increasing nationalism and political adventurism?
There are likely a number of reasons. This is not really surprising when one considers that markets only consider politics as one element of risk. Global central banks have been very accommodating, corporate earnings have continued to grow, we’re seeing tax cuts and deregulation in the U.S., and global GDP growth seems to be picking up. And, “animal spirits” are on the rise.
Though I rarely agree with Krugman, in many ways he has my sympathy: His position requires him to forecast and re-forecast constantly while his politics force him to an extreme viewpoint. Both are difficult to support, especially when we remember the famous quote from John Kenneth Galbraith:
We have two types of forecasters: those who don’t know and those who don’t know they don’t know
Forecasts of short-term market returns, in general, have been found over and over to prove out to be worse—usually much worse—than random. 2017’s combination of poor forecasts and terrific performance were instructive of the way HH looks at managing money:
Don’t let political beliefs, forecasts, and philosophy derail data-driven, strategic approaches. At the same time, make sure the data being observed, which may suggest non-traditional solutions, are given full consideration.
WHAT (IMPRECISELY) ARE EXPECTED RETURNS?
It seems to us an ideal time to initiate the irregular return of Time & Money to supplement our Quarterly Insights pieces in placing many of these insights into a larger context.
In this commentary, we hope to shed light on three main areas:
- How do we differentiate data analysis from so-called forecasting?
- What do we mean when we speak of expected returns?
- Why do we keep using the term 60:40—and what does our transformative thinking about this mean for investors like you?
For those reading this in hardcopy, the papers we cite can be located at www.halberthargove.com/news otherwise, hyperlinks will take you directly to each title.
As we sift through the observations below, it will be important to understand fully the concepts above. Let’s start with 60:40. This refers to the standard central allocation of most investors to 60% equities:40% fixed income.
Knowing the U.S. stock market’s propensity to move in a positive direction—about 70% of the time—and the long-term outperformance of equities (stocks) over fixed income (bonds), why would this be a standard allocation? Because, of course, risk and volatility in the short run are major considerations. We use the term 60:40 broadly to refer to a fully diversified portfolio balanced to an appropriate risk/return profile for a specific client.
While we are not forecasting returns over any shorter period, we can abstract some useful information from financial history to guide our longer-term planning and expectations. It helps if we better understand the concept of expected returns and how those expectations are built.
How do economists arrive at expected returns? Almost all use a combination of anticipated growth in population, plus productivity—as markets typically cannot exceed underlying economics in perpetuity (which is a period just a bit longer than anyone expects). Added to this calculation are current yield or dividend yield, as well as some market multiple of corporate earnings. Generally, we’re fairly accomplished at the first two measures over longer periods of time. But there is a very broad range of opinions about what current multiples mean, whether profits can continue at historically high proportions of GDP, and what the overall trends might be.
Many major investment banking and money management firms publish such expectations to help clients plan; currently, these expectations are quite a bit below historical performance. Since they all use slightly different methods and time periods, some license is taken to show as broad a range as possible.
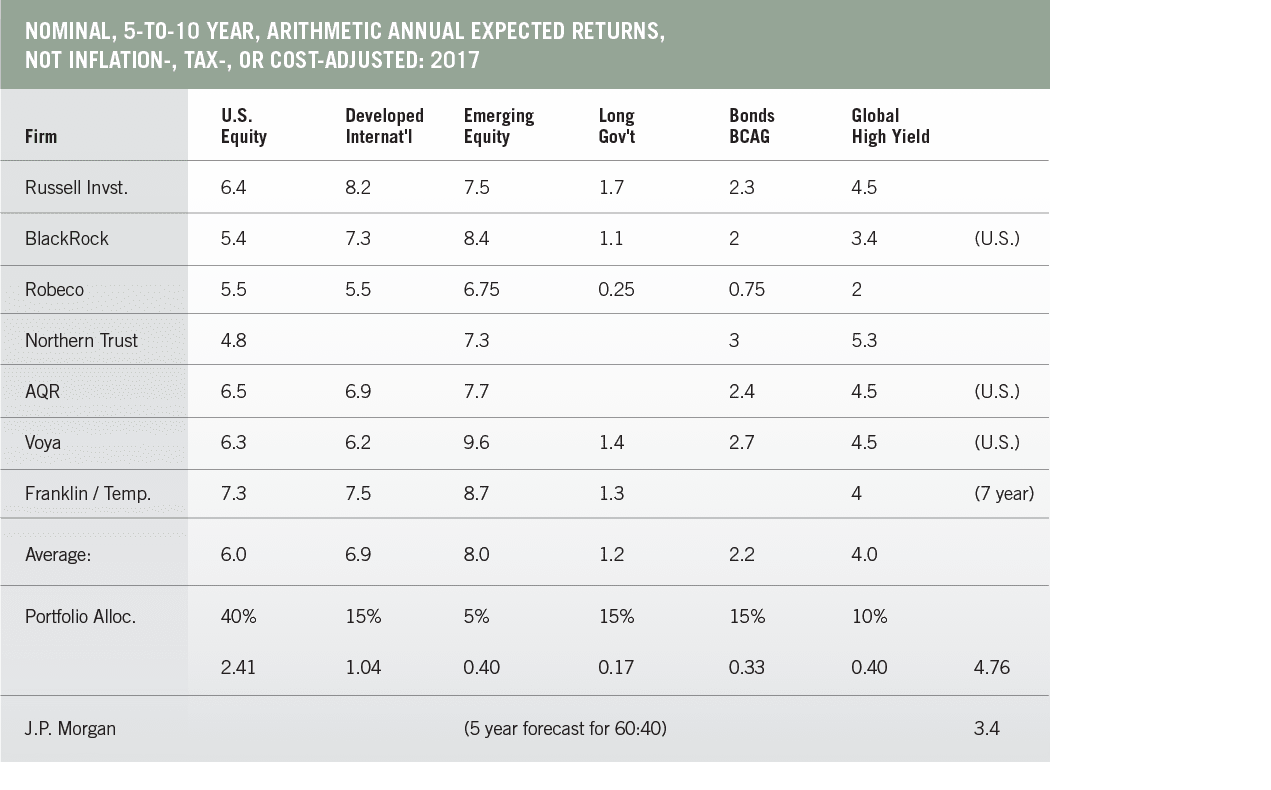
How can we square these expected return figures with the actual performance of 2017? Perhaps the easiest way is visually:
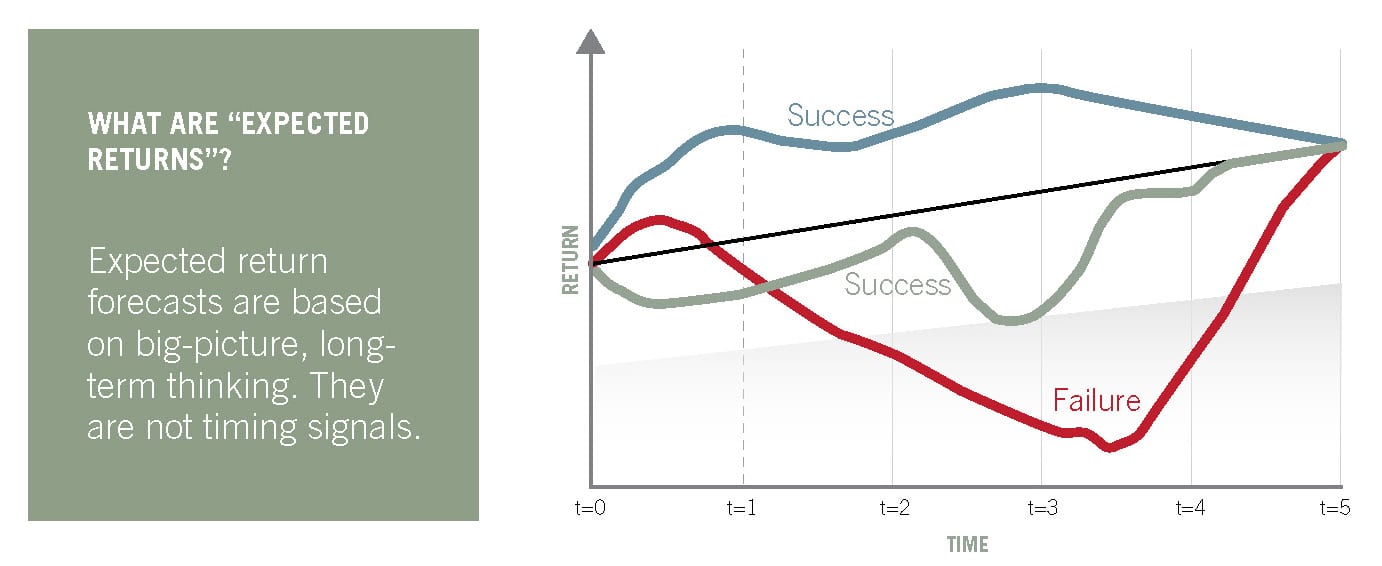
A five-year expected return forecast is just that: It runs from t = 0 through t = 5 and does not purport to show the path in the interim. Yet that path can be critically important for investors. The “failure” shown above could represent missed covenants, needed cash withdrawals, or a stronger-than-forecasted aversion to loss—which causes capitulation, a fancy word for throwing in the towel.
It is not only possible, but likely in our view, that 2017 fits comfortably into the t = 0 to t = 1 pattern. This doesn’t preclude the following year (t = 1 through t = 2) maintaining an upward slope as well.
Expected return forecasts are based on big-picture, long-term thinking. They are not timing signals. In our view, the most likely place for error in these forecasts is in earnings multiples—which could remain high due to low interest rates or high confidence. The second vulnerability is in measuring productivity. This has historically been difficult to measure accurately when much of the economy is based on intangibles, intellectual property, and massive quality improvements.
In our experience, longer-term views tend to be reasonably accurate; the difficulty is in the year-to-year, calendar-constrained approach.
While imperfect, investors need this information to determine the appropriate savings rates and spending patterns they’ll need to fulfill their individual financial goals.
SIX OPTIONS FOR A LOW-RETURN WORLD
We think a helpful framework for digesting this stew of 60:40, forecasts and expected returns is the thought organization suggested by Howard Marks of Oaktree, the world’s largest investor in distressed credit. The following list of six “limited options” is his. The analysis of each of these options is ours.
THERE ARE LIMITED OPTIONS IN A LOW-RETURN WORLD:
- Invest as you always have and expect your historic returns
- Invest as you always have and settle for today’s low returns
- Reduce risk to prepare for a correction and accept still-lower returns
- Go to cash at a near-zero return and wait for a better environment
- Increase risk in pursuit of higher returns
- Put more into special niches and special investment managers
Each of the sections below will have our summary answers to Marks’ six possible courses of action—plus a deeper discussion of our response for those interested in more detail.
1. Invest as you always have and expect your historic returns
SHORT ANSWER
With interest rates at generational lows and equity markets pretty much fully priced, it is not reasonable to expect near-term returns to equal recent history—which have strongly rebounded off the multi-year lows that followed the Global Financial Crisis.
It is still true, however, that one can reasonably expect equities to outperform bonds and cash.
DISCUSSION
We use the concept of 60:40 to describe a balanced portfolio, but the way in which equity and fixed income return forecasts are developed differ a great deal in their complexity and dispersion.
Equities
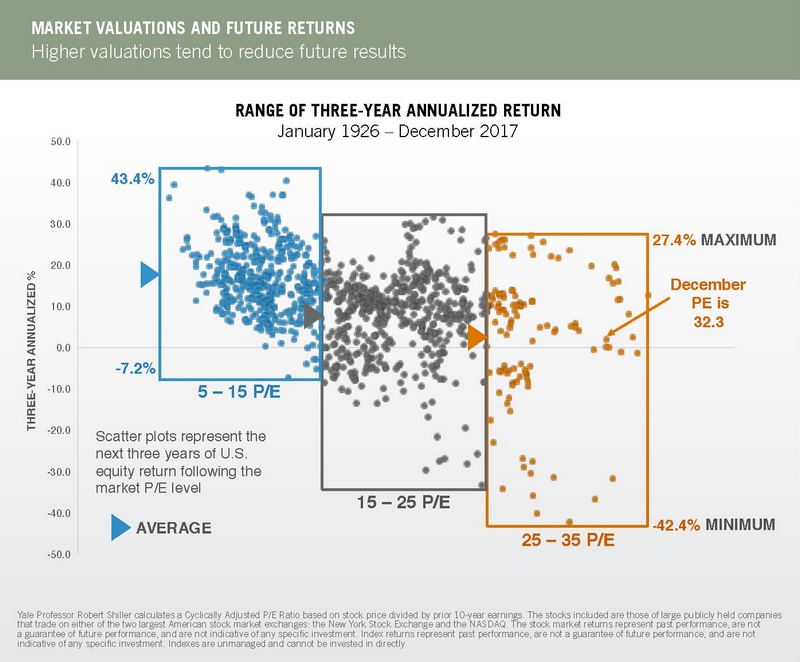
The following chart from Russell Investments provides a useful way—from the context of starting market valuations—to view both current equity market (U.S.) valuations and historical return patterns. Note that at any starting valuation there is a broad distribution of historical three-year compounding equity returns that follow it—but there is no one-to-one ratio or forecasting tool that offers precision.
Equally interesting is that the subsequent range of returns, segmented here into three different starting regimes in terms of Price/Earnings (P/E) level, have progressively lower high-end and lower low-end returns. This factor, taken with the chart above that outlines the expected return forecasts cited by major financial institutions, is what we mean by a lower-return environment for equities. No immediate “crash” is forecast.
Return forecasting is messy because the world is messy; it isn’t a plot to make one person seem smarter than another.
We know we don’t know.
Does history control outcomes? Of course not.
Future returns could well fall outside “the box”—in either direction. But we believe analyzing history is useful in giving us probabilities and ranges.
Here’s another historical perspective:
From 1945 to September 2017, the CAPE (Cyclically Adjusted Price-to-Earnings) ratio spent 36 percent of rolling periods in the 5-to-15 range, 48 percent in the 15-to 25 range, and 16 percent of the time above 25x trailing 10-year average earnings. But a timing signal the CAPE ratio is not.
Fixed Income
Fixed income returns, relating to both interest-rate levels and trends, are a different matter in terms of return-forecasting dispersion. The chart below details clearly the tailwind for the stock and bond for the 60:40 portfolio from the early 1980s forward.
The fact that we tend to remember recent performance and overweight it in our thinking is well documented in the Behavioral Finance literature. This graphic illustrates the last gasp of the declining U.S. interest rate tailwind; the actual headwind of possible (probable?) rising rates is less clear for stocks than bonds.
Fixed income returns have, aside from credit and reinvestment risk, the feature of certainty: A 10-year bond will return its yield and principal amount. Starting at two percent-ish rates does not allow for double-digit returns—except, we suppose, for the very longest-term Treasury bonds in an unlikely negative rate environment. A risky holding indeed, and one that would only work with perfect buy/sell timing to take advantage of interim price changes.
Note the labels of “excess returns” in the graphic below:
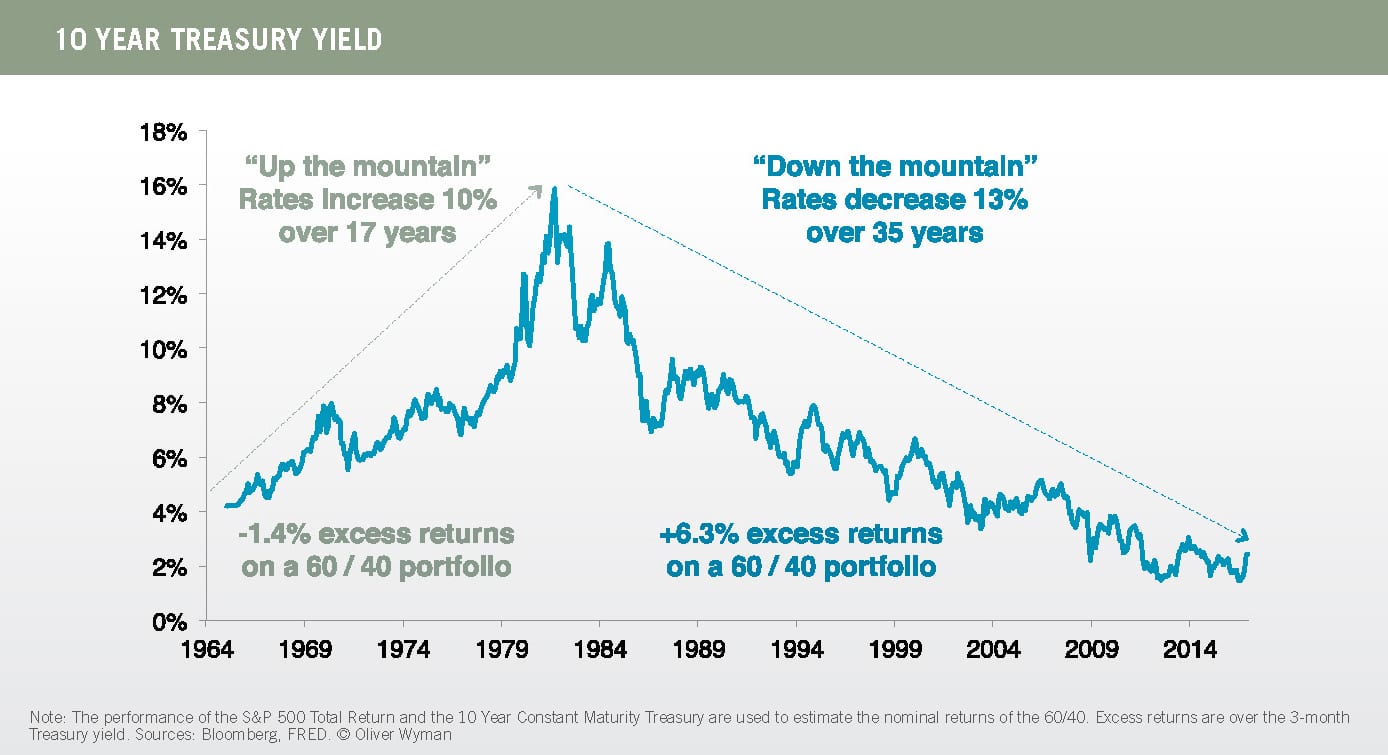
Returns are compared to the 3-Month Treasury yield, so a negative excess return may still be a positive absolute return.
In summary, our current beginning valuation levels indicate lower but positive returns from the equity markets (we use the U.S. as proxy for global markets since we have much better data for the U.S.). Fixed income returns, limited by low current interest rates, are bound to be in the low single-digit range and perhaps even negative in some periods. Not a prescription for matching historical returns.
2. Invest as you always have and settle for today’s [expected] low returns
SHORT ANSWER
This is actually a rational response. Unfortunately, the current expected returns aren’t high enough for most people and organizations to fund their financial goals. By the way, we added the “expected” to Howard’s remarks, as we are primarily concerned with future returns, don’t want to rely too much on forecasting—and even believe that equity returns might surprise on the upside.
DISCUSSION
The traditional 60:40 portfolio faces unfortunate math: Expected returns are likely to be modest. Equity returns could surprise to the upside with higher-than-forecast productivity. This would likely arise from emerging technologies, and what might be called “working-age population growth” through the recalibration of such ideas as “normal retirement age” adding to our workforce. For most investors, however, the prospect of increasing longevity requires—or would certainly benefit from—the higher expected returns potentially deriving from changed asset allocations and adding non-traditional sources of return, which we explore in #3 and #6 below.
3. Reduce risk to prepare for a correction and accept still-lower returns
SHORT ANSWER
Based on the equity and fixed income returns we expect over the next few years, we’re electing to change the character of risks accepted. This doesn’t necessarily mean increasing risk in the traditional sense of portfolio return volatility.
This is the longest section of our commentary, since it will take a bit to discuss the differences in HH’s portfolios from the standard 60:40.
DISCUSSION
Most balanced portfolios have upwards of 90% of their volatility risk in equities due to the different characteristics of equity and fixed income returns. Adding more and/or different equity markets does little to reduce this figure. Passive, capitalization- weighted index investing, while inexpensive, tends toward very heavy concentration in a few, very large companies. This is a great strategy until it isn’t. In our view, the “when” is not forecastable.
We do not believe there is any silver bullet leading to success. Rather, there is a series of incremental changes that can help increase expected returns by adding new and lower-correlated return streams, at acceptable risk levels.
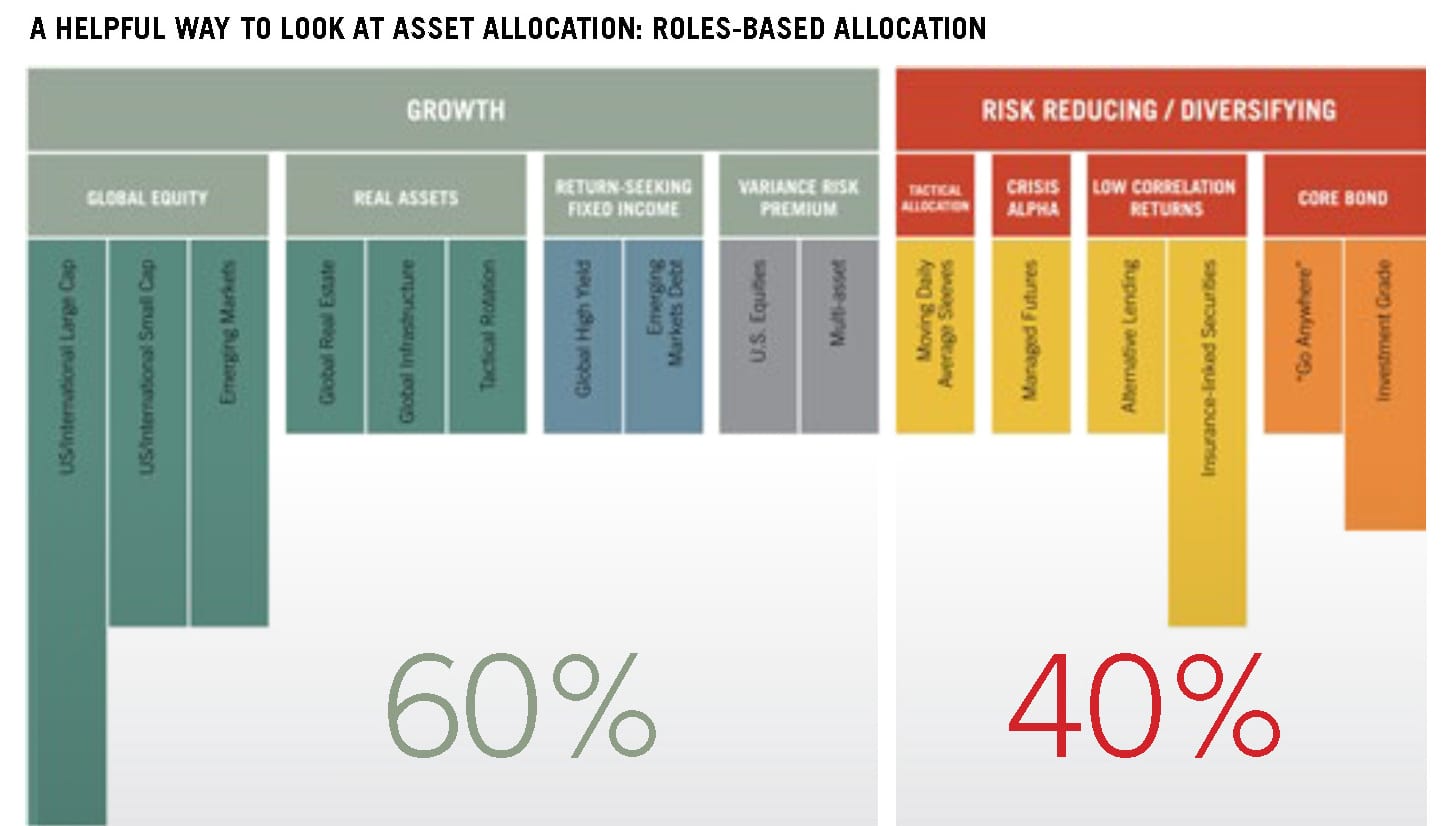
Here at HH, we look to three major attributes in creating investment portfolios:
- Roles-based allocations
- Moving from Fragile to Antifragile holdings—more on this below
- Balancing convergent and divergent assets, which is somewhat related to #2 above
Let’s start with #1
A clear beginning point arises from looking at portfolio construction differently: Instead of “stocks and bonds,” one can view portfolio building blocks from the standpoint of the roles they play in terms of return streams, volatility, and correlation.
A detailed look at each roles-based allocation category is provided further on.
Most portfolios are well represented at the outside edges of the graphic below. Increasingly, this is achieved through low-cost passive investing, which carries often poorly understood concentration risks. For a large majority of everyday investors, portfolios are not adequately exposed to the return streams shown in the middle.
We believe the answer to whether active or passive approaches should be used is yes. Both make sense, in the appropriate balance and where each is most likely to yield the best risk- and cost-adjusted returns.
Beyond that answer, we believe a significant portion of equity assets should be invested by looking at underlying return factors that have been well rewarded over time and that tend to have low return correlations among themselves.
Return factors have been studied, and used by investment managers, for decades. In fact, so many have been identified that they’re known as the “factor zoo.” But the majority of benefit flows from a few, familiar attributes: Value, Momentum, Size, Low Beta, Quality.
Focusing on factor implementation rather than pure indexing holds two strong sets of expectations for us: 1) over time, and on average, results should be better, net of fees and costs, than index investing; and, 2) the tracking error—how much interim results vary from capitalization-weighted index returns—will often be considerable.
To reduce the impacts of these tracking deviations from passive index investing, what best fit our requirements are rules-based, multi-factor funds that are subject to rigorous diversification constraints.
Robust and Antifragile
Nicholas Nassim Taleb wrote Fooled by Randomness, in which he introduced the concept of Black Swans, dangerous tail risk events that could seriously damage a portfolio. In a follow-up work, Antifragile, he introduced the concept of fragility, which we think a better descriptor of overall risk than standard deviation. In Taleb’s construction, there are three kinds of portfolio allocations:
Fragile, which is highly subject to volatility and interest rate risk
Robust, which is indifferent to either
Antifragile, which actually benefits from dislocation and volatility
Taleb’s solutions to reach that state of antifragility, which seems appealing on its face, carry risks and psychological burdens too great for most of us. But we think moving toward robust and antifragile portfolios is a powerful and useful approach.
Balancing convergent and divergent assets
A similar concept helps us look at asset returns as either convergent with market returns or perhaps diverging, i.e., diversifying market returns. The point is that, at any given point in time in the markets, the unpredictable can and does happen. As our writers of HH’s Convergent vs. Divergent Approaches are Playing Out “As Planned,” emphasize, maintaining this kind of balance of assets can be likened to holding insurance or having a back-up plan—in case the first plan doesn’t work out as you anticipated.
Here’s an overview of the assets we utilize in our roles-based allocations:
GROWTH ASSETS
US/International Large Cap: Highest correlation with equity risk, but no real capacity limitations on investing. Diversification works well in combating the idiosyncratic risks of individual securities, but global linkages mean there is less protection against drawdown in most market cycles. Recent performance likely reflects coordinated global growth, so that even with expectations of lower expected returns it would be too expensive to reduce exposure here. Instead, significant portions of equity exposure come from factor-based investing, which focuses on long-term rewarded factors such as value, size, momentum and quality. This focus will almost certainly lead to tracking error versus capitalization-weighted indices such as the S&P 500, but will also greatly reduce concentration risk from holding a few very large stocks.
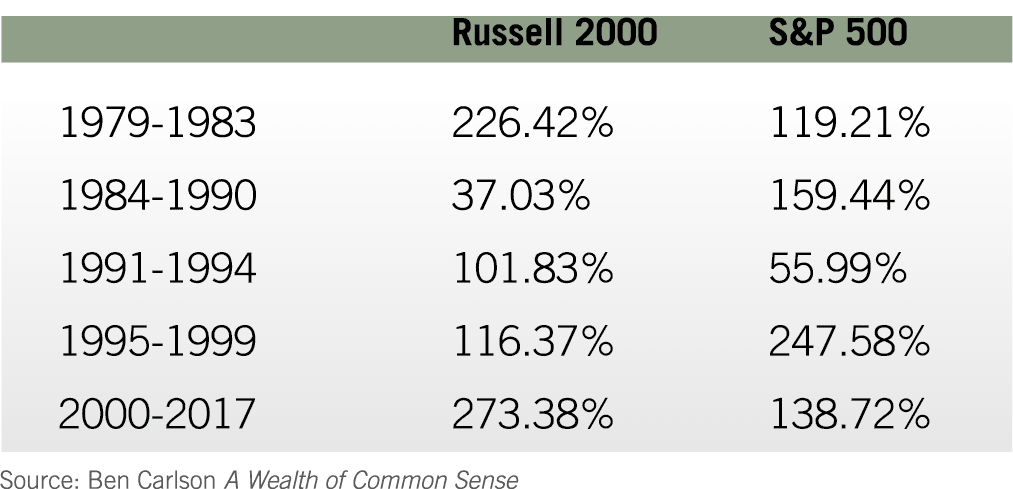
US/International Small Cap: Much less diversification of equity risk in terms of drawdown, but considerably differing return patterns, which can be useful at times, as the chart below makes clear.
A mix of factor-based and active management is used here and, to varying degrees, in emerging markets.
Emerging Markets (equity): Much has been made of the increasing stability and strength of many emerging markets, along with projected higher economic growth rates and better-than-developed-markets valuations. While these factors exist, they are also partnered with higher market volatility. It is unlikely that emerging market equity prices have become unlinked from developed market prices to any significant degree, so the contribution to diversification through adding emerging equities is de minimus.
Global Real Estate/Global Infrastructure: Held in public equity format, these assets tend to act like small cap stocks. They also generate higher-than-average dividend income, making them sensitive to interest-rate-shift expectations. Private versions of each contribute nominally to diversification primarily through (in our view) stale pricing, and can require a significant illiquidity premium to make them attractive.
Tactical Rotation: We include this strategy mostly as a growth element with some diversification benefit, though the more flexibility afforded a manager or quantitative evaluation of relative value, the more opportunities as well as mistakes. Contrarian views based on relative expected asset class returns can be successful over longer time periods, but can also be out of sync for longer-than-expected periods as well. Our episodic exposure to commodities also resides here. We view this as both return-seeking and inflation-hedging focused.
Global High Yield: This type of credit generally serves at least partially as an equity substitute; it tends to be far more highly correlated with equity risks than longer-duration, higher-quality fixed income. The current spread compression has caused us to underweight this asset class. Unlike expected returns from equities, which can easily surprise to the upside, high yield expected returns in lower-rate environments are reasonably capped at current yield levels.
Emerging Market Debt: With higher yields than domestic fixed income, higher underlying growth rates of economies supporting their currencies (mostly), and fairly significant diversification elements as a bonus, we retain a broad exposure here to both local and sovereign debt.
Variance Risk Premium: Various techniques exist to capture excess option premiums arising from the tendency of options markets—for hundreds of years—to overprice expected volatility. The point is that realized volatility is usually less than expected volatility. In essence, this is a liquid market approach to insurance with the seller, on average but not always, capturing profits.
U.S. Market VRP is fairly highly correlated with U.S. equity markets. The technique can also be used with global equities, currencies, interest rates, and commodities. The resulting correlation of VRP returns with equity returns is far lower, such that this area could almost be in the diversifying category.
Utilizing call overwriting—securities owned with call options sold on them—has tended over long periods to return about the same as a broad equity index, but with about 2/3 of the volatility of the index. Although this tactic is often cited in a risk-reduction context, our focus here is on return generation, as higher income than the index is typically generated.
RISK REDUCING/ DIVERSIFYING ASSETS
Moving Daily Average (MDA): Market-based price signals in trending markets are used to create trading rules intended to avoid most (but not all) of downturns and take advantage of most (but not all) of subsequent upward trends. See also: Tactical Allocation and the Moving Daily Average. The underlying assets are in cash equivalents when out of the market and capitalization-weighted passive or index-based vehicles when in the markets, thus reducing costs and providing additional growth in strongly upward-trending markets.
Managed Futures: Utilized primarily as a form of protection against falling markets, managed futures are often cited for creating crisis alpha—often positive, and better-than-market returns—during downturns. The majority of these techniques are trend following. Over time, returns have been roughly equivalent to equity market returns, with both lower volatility and very low, or even negative, correlation with equities.
This makes the inclusion of managed futures in a portfolio highly efficient—except when “trends” reverse too quickly and often, creating the dreaded “whipsaw” effect. In our case, trading costs are relatively low, which makes this less important; the focus is, however, on taxation. While best held in a tax-favored location, tax realization also adds to tax basis, so a longer-term taxation view is relatively benign as is the case with MDA.
Alternative Lending: Technology first enabled peer-to-peer lending and now supports various financial entities to at least partially disintermediate traditional banking channels. Broad diversification, solid underwriting, and high credit standards should protect against any higher-than-normal default levels. Short loan duration, pooled with others, should largely eliminate the negative effects of rising interest rates, and, depending on how fast rates increase, might actually benefit from increasing rates.
Insurance-linked: These securities are usually either catastrophe bonds (“Cat bonds”) or quota shares, or both. Cat bonds are paid an expected yield minus specific losses in excess of the formula agreed upon when issued. Quota shares represent a pro-rata share of all the risks a particular reinsurer has underwritten; they likewise receive the initial premium less excess losses. Since these are insurance instruments, they tend to be priced in a “hard market,” i.e., after a serious wildfire season of losses, in cases like these, premiums usually increase, sometimes dramatically. While returns generally have no correlation with equity market returns, it is also true that a bad hurricane season might occur at the same time as poor equity markets. So traditional portfolio construction must account for a somewhat more sophisticated scenario analysis.
Investment Grade Bonds: These provide true diversification of equity risk, though with low to perhaps slightly negative returns. Currently, a smaller-than-traditional allocation to these bonds continues as an effective anchor to windward.
For more detail on these instruments and issues, please see our previous work at: Portfolio Risk Exposures as a Bed of Nails: Moving Beyond Historical Diversification Tools; The Cat vs. the Washing Machine; and Sometimes I Wake Up in the Middle of the Night, Thinking About Standard Deviation.
4. Go to cash at a near-zero return and wait for a better environment
SHORT ANSWER
Peter Lynch of Fidelity Magellan fame said it best: “More money has been lost in preparing for corrections than has ever been lost in the corrections themselves.”
DISCUSSION
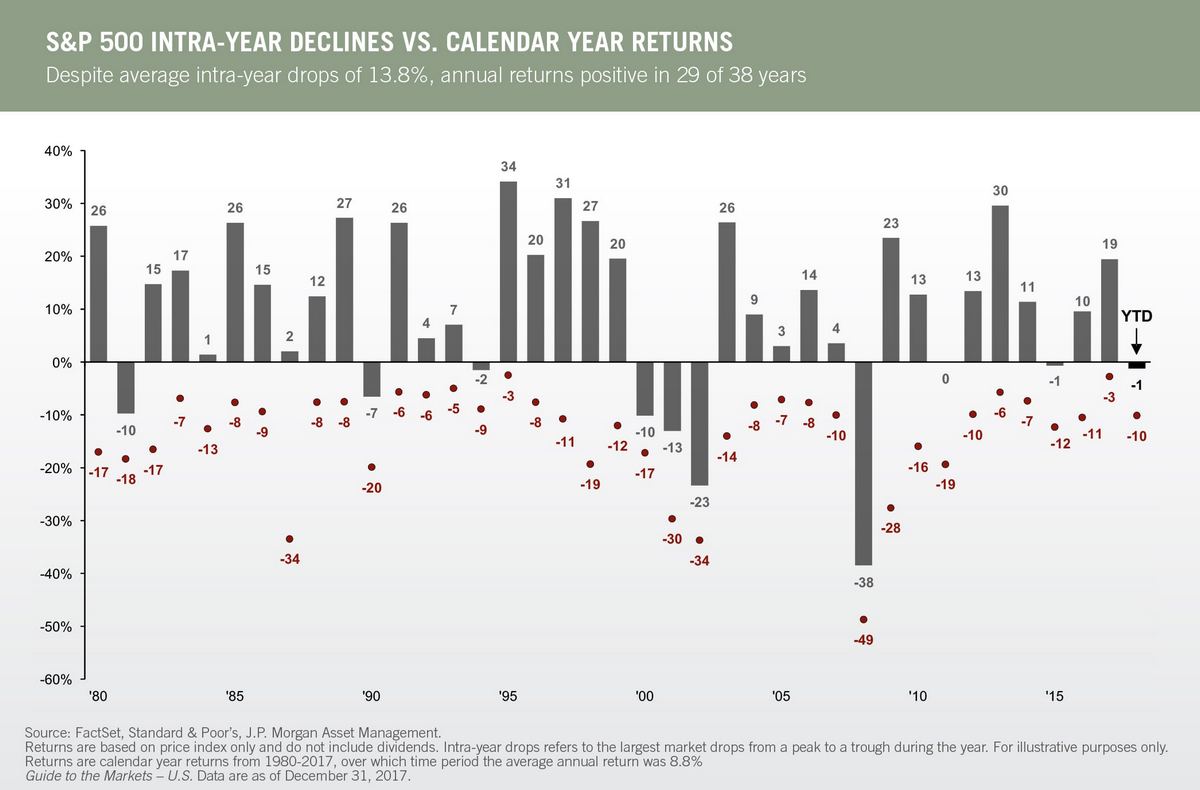
We know that investors tend to be more loss averse than risk averse. But we’ve never found anyone who could consistently and successfully move in and out of markets to avoid what we’d call (at least prior to 2017!) normal market volatility.
For various legal, practical, and behavioral reasons, many investors cannot accept the normal, historical U.S. stock market return volatility displayed below. Those who can take the risk expect, and most often receive over a longer or rolling time period, higher returns than those who insist on a much smoother ride. While we don’t enjoy volatility any more than others do, we believe the proper course of action is to accept as much volatility as possible (if needed to reach specific financial goals) and keep reserves for those inevitable downturns associated with equity investments. Again, no silver bullet.
And there is a real cost to insistence on a smooth ride: If one focuses exclusively on preserving capital and positioning for the next huge market crash, substantial market gains can be missed. Missing out on large gains can be just as detrimental to investment performance as taking part in large losses.
The table below shows the loss required to break even after missing out on a large gain. “Loss required” means how large the market break needs to be to make sitting out of it worthwhile.
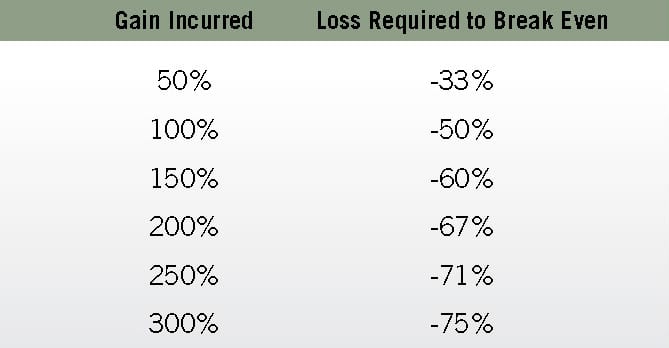
Hard as it may be to believe, there are still a significant number of investors waiting for better times to re-enter the markets since 2009.
5. Increase risk in pursuit of higher returns
SHORT ANSWER
Accepting greater risk is usually a price for earning higher returns, but there is not a direct relationship between higher risk and higher returns—or it wouldn’t be risk. Taking on more risk might be an appropriate idea for a younger, accumulating investor, but is unlikely to be wise for an investor in transition or who has reached the decumulation phase.
DISCUSSION
Warren Buffet’s rules for investing success:
- Don’t lose money
- Don’t forget Rule 1
6. Put more into special niches and special investment managers
SHORT ANSWER
We believe this is an area in which individual investors might actually have an edge due to limited market capacity in some asset classes and investing techniques.
DISCUSSION
We’ve commented extensively on these ideas in our dinner seminars and in our commentary The Death of 60:40. The naming is a bit over the top, but sounded better than, as David Koch and Taylor Sutherland put it, The Hibernation of 60:40. The latter is likely more accurate, as the time for focusing more on straightforward stock and bond allocations will probably come again.
The idea of creating a balanced portfolio to control risk has clearly not departed. What has changed are the tools and techniques available to implement that desired risk/return balance.
Technology enables inexpensive access to factors and to options trading in our growth portfolios, and has driven down costs in managed futures. Negotiated access to reinsurance carriers allows us to gain size-of-market constrained access to these non-correlated returns.
Competition is driving down asset management costs, which enables an investor to pay for value rather than access and determine whether an active or passive approach is more beneficial. Please refer to Some Things are Worth Paying For for our more detailed exploration of this topic.
WHAT NOW?
In terms of our responses to Howard Marks’ framework, we’re somewhat focused on #2, whose byword, basically, is to stay the course. Primarily, however, it’s #3 and #6 where we’re investing our attention: zeroing in on approaches that can reduce risk, and strategically placing more assets into special niches and special investment managers to increase the expected return from our re-envisioned 60:40 portfolios.
Many years of experience tell us not to look at year-ahead forecasts. These tend to be confusing and, in the end, somewhat less than useful. In fact, to be honest, somewhat less than worthless. To paraphrase the carpenter’s mantra of measure twice, cut once, we find that reading many forecasts (at this point, more than 25) and making changes very, very carefully is most prudent.
The ever-insightful W. Ben Hunt, in writing about the irrelevance of past investment performance in predicting the future for his website Epsilon Theory, observes:
The Three-Body Problem is a famous example of a system which has no derivative pattern with any predictive power, no applicable algorithm that a human could discover to adapt successfully and turn basis uncertainty into basis risk. In the lingo, there is no “general closed-form solution” to the Three-Body Problem.
What is the “problem”?
Imagine three massive objects in space … stars, planets, something like that. They’re in the same system, meaning that they can’t entirely escape each other’s gravitational pull. You know the position, mass, speed, and direction of travel for each of the objects. You know how gravity works, so you know precisely how each object is acting on the other two objects. Now predict, using a formula, where the objects will be at some point in the future.
Answer: You can’t. In 1887, Henri Poincaré proved that the motion of the three objects, with the exception of a few special starting cases, is non-repeating. This is a chaotic system, meaning that the historical pattern of object positions has ZERO predictive power in figuring out where these objects will be in the future. There is no algorithm that a human can possibly discover to solve this problem. It does not exist.
And that of course is the basic problem we have in economics and investing.
When we say that past performance is not indicative of future results, that aphorism is more than just legalese.
The actual portfolio appropriate for an investor must, of course, be grounded as best we can make it in economic and financial reality. But the far more important part of the process is understanding an investor’s personal financial goals, needs, and limitations. We’re pretty far along—with very smart consultants—in developing an additional tool to serve as a checkpoint in this process, which we are calling LifePhase Investing®.
For most investors, their investment time horizon and its probable extension through increasing longevity will bring the biggest risks and rewards. And for most of us as well, along with the shifting nature of what we consider work and retirement, continuing to develop our human capital may well be necessary—as well as well rewarded.
Here at HH, to help us sort through accelerating changes, we’ve developed and are supporting a highly active and open-minded Investment Committee, one with, as always for us, no attachment to proprietary products. Cryptocurrencies such as Bitcoin, and the far more important area of blockchain technology, will undoubtedly be a major focus for the next year or more.
Exciting as that may be, we don’t intend to leave equities behind. They are and have been the highest- returning asset class with essentially unlimited capacity. As—, and if—, markets continue higher, we’ll be evaluating whether to increase our MDA percentage and other protective devices. Stock markets can surprise to the upside.
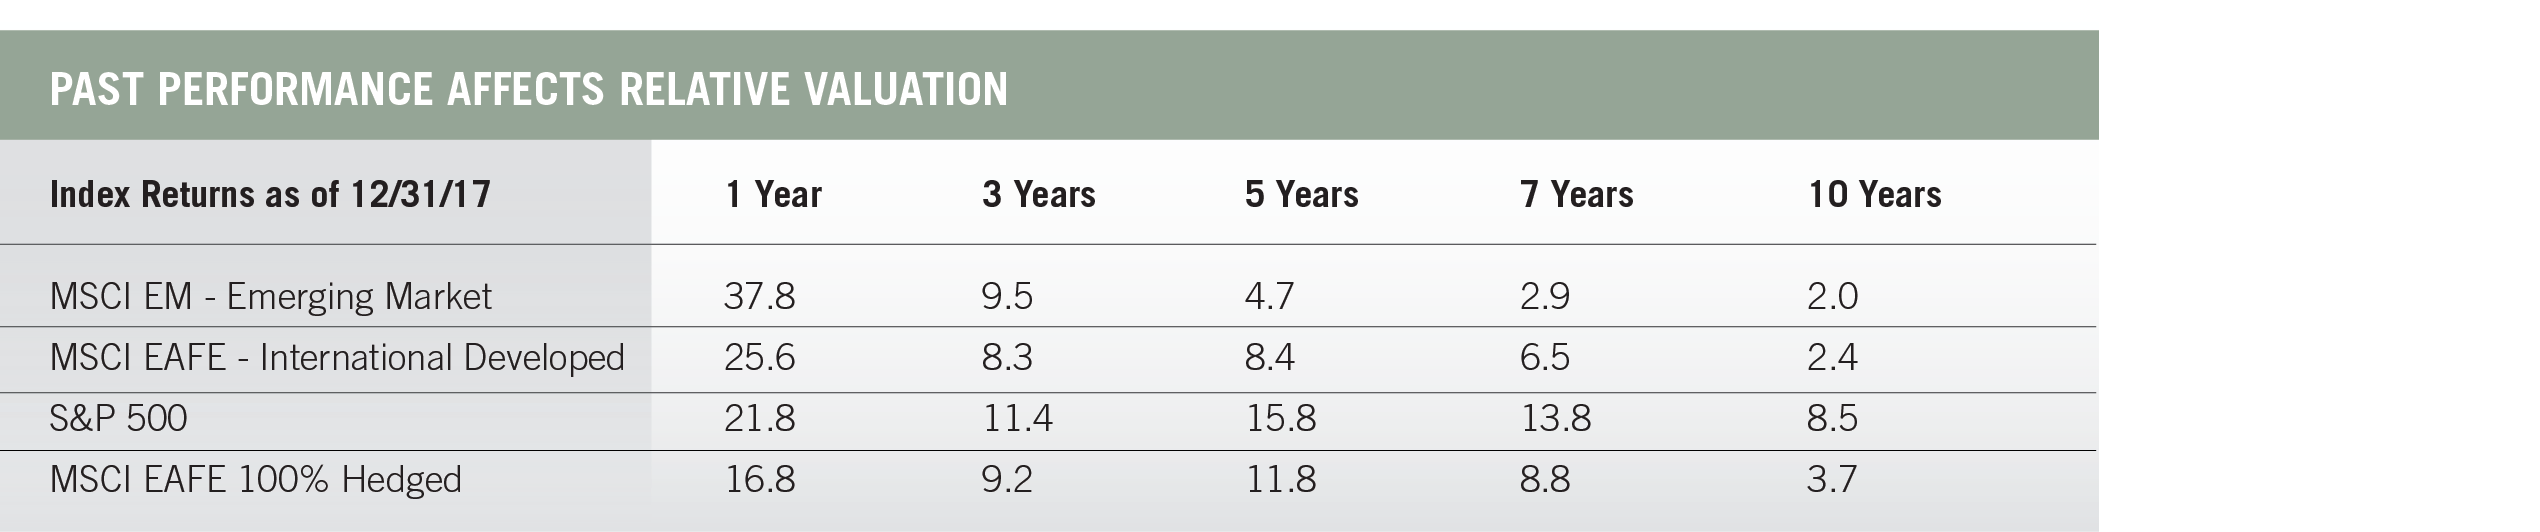
The relative valuations of developed and emerging markets, and the expected higher growth rate of emerging markets are likely to point toward an increasing share of our portfolio allocations in these areas.
To conclude: What if “expected” return projections are wrong?
We say to ourselves every day: We cannot predict the future, but we make every effort to explore and prepare for the possibilities. Therefore we diversify.
RISKS AND DISCLOSURES The views contained herein are not to be taken as an advice or recommendation to buy or sell any investment. Any forecasts, figures, opinions or investment techniques and strategies set out are for information purposes only, based on certain assumptions and current market conditions and are subject to change without previous notice. All information presented herein is considered to be accurate at the time of writing, but no warranty of accuracy is given and no liability in respect of any error or omission is accepted. This material should not be relied upon by you in evaluating the merits of investing in any securities or products mentioned herein. In addition, the Investor should make an independent assessment of the legal, regulatory, tax, credit, and accounting and determine, together with their own professional advisers if any of the investments mentioned herein are suitable to their personal goals. Investors should ensure that they obtain all available relevant information before making any investment.
