“Compound interest is the eighth wonder of the world. He who understands it, earns it; he who doesn’t, pays it.” – Popularly attributed to Einstein, although without evidence
“Scientists have developed a powerful new weapon that destroys people but leaves buildings standing — it’s called the 17% interest rate.” – Johnny Carson
Peter Minuit (1580 – 1638) was appointed the third director of New Netherland by the Dutch West India Company in 1625. On May 24th, 1626, Minuit purchased the island of Manhattan from the natives — perhaps from a Metoac band of Lenape known as the “Canarsee” — in exchange for traded goods valued at 60 guilders. In 1846, that price was converted by a New York historian to $24, and a legend was born.
A 2014 paper in the journal Regional Science and Urban Economics estimated that the developable land in Manhattan, excluding highways, roads, and parks, was worth about $1.7 trillion.
That’s about a 4.8% return — assuming no volatility.
The bigger the spread, the greater the risk
Rarely are we asked by clients about the previous year’s volatility. Why would they? Volatility is rarely discussed outside investment professionals, and seldomly among them. Like we discussed in our earlier paper, Sometimes I Wake up in the Middle of the Night, Thinking About Standard Deviation, volatility is the other side of the coin from returns – and it matters!
Not all returns are created equal. We’ll demonstrate with some quick and easy math — and then back to our normal programming.
- If I start with $100 and achieve a +10% return (which is +$10), I now have $110. If I then have a -10% return (which is -$11), I now only have $99.
- However, if I have $100 and achieve a +20% return (which is +$20), I now have $120. If I then have a -20% return (which is -$24), I now only have $96.
Clearly, volatility is a slippery slope; the bigger the spread between up and down returns, the deeper the hole that must then be filled before you get to break even.
A quick aside: Before we get lambasted by our peers, we’re not going to pretend there isn’t a difference between the arithmetic and geometric mean. In the examples we’re giving, we’re simplifying the math — but the point is to keep things simple. The fact is, the industry has done a poor job of educating the public about the impact of volatility on the growth of their investments.
2019 is a real-world example of this problem. Sure, we’re all celebrating the phenomenal gains of stocks on the year. The S&P 500 (still not your benchmark!) was up a whopping 31.5% in 2019! However, since it was down almost 20% from 9/20/2018 to 12/24/2018, a 24% gain was required just to get back to par. Only the remainder — 7.5% — made for new gains.
Here’s another, even more volatile, example. Apple stock was up 86% in 2019. Sounds great, doesn’t it? The fact is, Apple stock was down more than 30% in just the last three months of 2018. Which means from October 1st 2018 to October 1st 2019, the stock was still down 1%. It took the first 10 months of 2019 for Apple just to recover what it had lost in the fourth quarter of 2018.
Here is a chart that further demonstrates this issue:
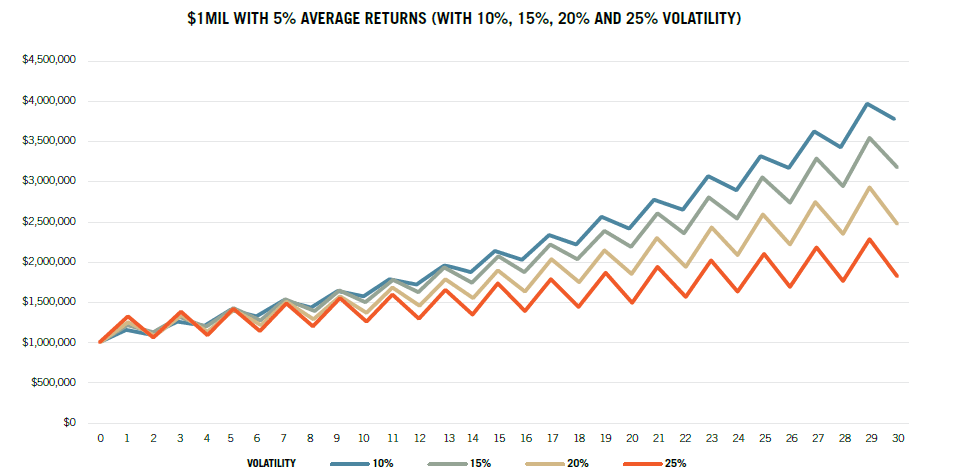
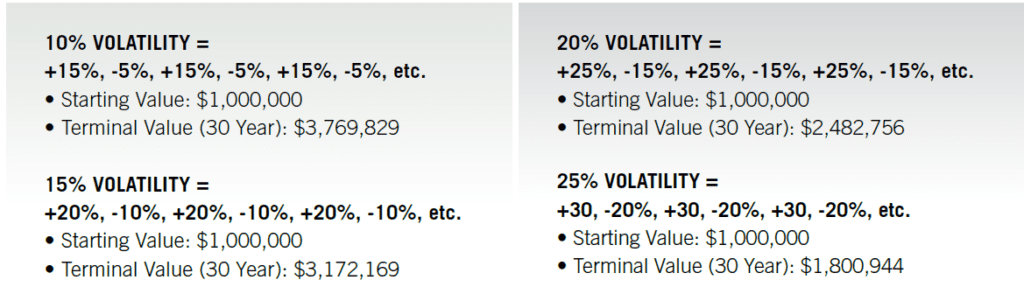
All four of these lines represent an average 5% return. The only difference between them is how much the returns fluctuate from year to year. In the case of the 10% volatility example, with 5% as the average return, you oscillate between a +15% one year and -5% the next. Specifically, each line is represented as follows:
In the short run, there’s not a wide difference in outcomes; notice how after year three or so the portfolios are tracking fairly closely. But after about the tenth year they begin to diverge quite a bit. And after 30 years, the differences are dramatic. The 10% volatility portfolio has more than $3.7mil but the 25% volatility portfolio has only $1.8mil. Call it the evil side of the “magic of compounding.”
…. And the need to spend down assets deepens the hole dug by volatility
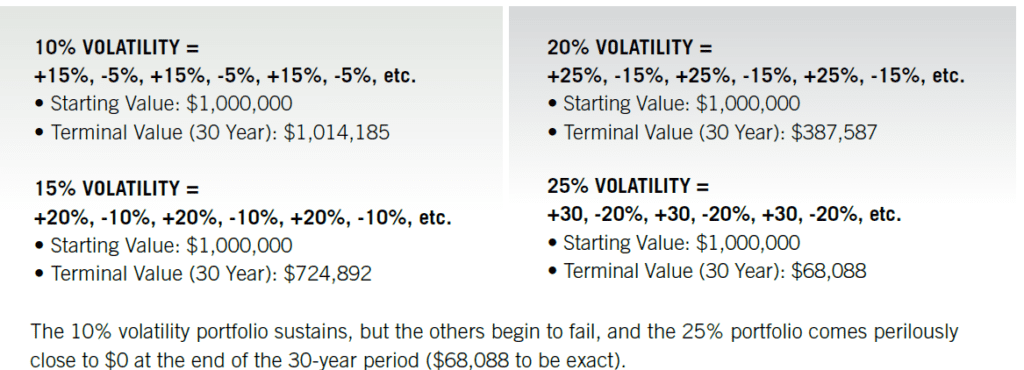
If this isn’t dramatic enough, things get exacerbated further when you need to spend from your portfolio. The following chart follows the exact same return pattern, but this time a $50,000 distribution is taken out each year ($50,000 out of $1mil starting at 5% average returns). Most people believe that if you make 5%, and you’re spending 5%, your portfolio will remain flat over time. Unfortunately, volatility kills this dream:
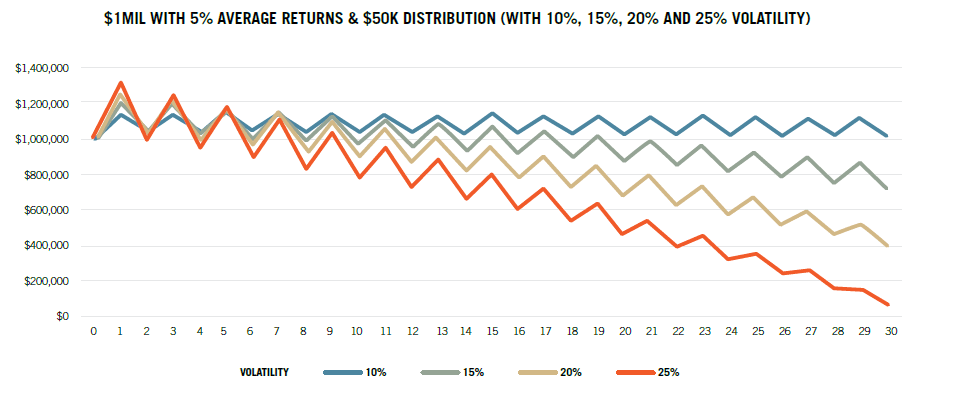
Same return patterns, but taking $50,000 out each year:
The bottom line here? Your money compounds more effectively as volatility is reduced. Sure, we’d all love a 30% one-year return, but not if we have to also experience a 20% drawdown to get it. There may have been a more conservative investment that could have earned that same 4% total return, but with a lot less heartburn. Just to reinforce the math lessons, a 20% decline followed by a 30% gain is a 4% return — and technically, that’s only 1.98% annualized over two years.
A matter of balance
So, we’ve reviewed why we think about volatility, even obsess over it, but we should take a moment to remind you of the ways in which we reduce volatility in our clients’ portfolios. We’ve written a series of quarterly letters on the subject, which can be found (HERE). But the short answer is that we diversify. We find investments that zig and zag at different times from one another, for different reasons.
Indeed, by definition, if all of your investments go up and down together, you do not have diversification. Less diversification may be okay for accumulators who have the benefit of adding resources on dips. But for those whose financial lives are in transition, and especially for those who rely on decumulation to help support their living expenses (i.e., the spending years), mitigating volatility is uniquely important. Just take a look at that second chart.
Investing is all about balancing the risks of failing fast vs. failing slow. In other words, taking on too much risk and realizing large drawdowns that permanently impair a portfolio — or taking too little risk and failing to grow assets to meet future liabilities. We are here to balance those risks in your portfolios.
For more information or questions, please contact Halbert Hargrove at hhteam@halberthargrove.com
