
By David Koch, CFP®, AIF®, CFA, Senior Wealth Advisor
A friend mentioned the other day that the Dow Jones was up 300 points, so “it must have been a good day.” When I started at HH in 2011 we use to call that a Pinkberry Day. If the Dow was up more than 300 points, the firm would buy everyone Pinkberry. Pretty sweet eh?
Since then, the Dow has nearly tripled – and a 300-point rise in the Dow is simply a normal day for the markets. But this “normal” for U.S. markets is abnormally normal. This blog aims to explain why.
Bell curves and market noise
We all know that the Dow is Not Your Benchmark, but the fact is, a normal move in the broad U.S. stock market is +/- 1% on any given day. In 2011 the Dow was about 11,000, and therefore a 300-point up move was a 2.7% increase – in a single day. That’s a big move; a gain of 2.7% in one day is clearly a reason to celebrate.
Now, in December 2020, the Dow is trading at ~30,000 and so a 1% move is +/- 300 points. A 300-point move today is essentially noise. It is well within a normal daily move. If those were still the firm’s Pinkberry rules, we’d expect to be getting Pinkberry 45 days a year, or almost once per week. I like Pinkberry, but not that much.
But you know that I didn’t write this to talk about normal. Let’s get weird. While the above is mostly true, the truth is even stranger. In investing, we talk about the expected return of something. This is the average return (also known as the mean). We also talk about the standard deviation of something, which is how much its price varies around its mean. A “normal distribution,” also known as a bell curve, is a good way to explain normal things. Mean and standard deviation work very well to describe and predict normal things.
Excessive amounts of normal
Stay with me here. The heights of people, for example, are normal. “Heights of adult women are approximately normally distributed with a mean of 64.5 inches and a standard deviation of 2.5 inches” (from Illustrative Mathematics). Knowing simply those two numbers (average and standard deviation), you could pretty accurately tell an American woman who is 5’9½” that she is taller than roughly 97.5% of other American women.
The stock market, however, doesn’t behave that way. In fact, there’s an excessive amount of “normal.” During the last seven decades for the S&P 500, the number of days that actually fell within that daily move of +/- 1% has been far too many than you would predict.
Since the standard deviation of the market is 1%, you would expect that roughly 68% of days would fall within +/- 1%. In his study of the S&P 500, Jason Apollo Voss, CFA, looked at daily stock market returns from 1950 to 2020 and found that instead of 68% of daily returns falling within that 1% move (like a normal bell curve would predict) – almost 94% of them did.
What this means is that 94% of daily stock market moves are within +/- of 1%. That’s unusual. Unusually normal. Got it. But that’s not all. What creates this abnormally high amount of normalcy is also what creates a very high amount of non-normalcy – what people call “fat tails.”
Fat tails – and water balloons
Think of the bell curve as a water balloon, if you squeeze the top then the bottom squirts out. All that water in the balloon has to go somewhere. If you’re making the top pointier then you’re also making the bottom wider (see my awesome drawing below). Instead of a bell shape, what actual daily stock market returns look like over time is a pointy peak in the center (with most days within +/- 1%) – and then fat tails (more highly unusual outliers than you would predict).
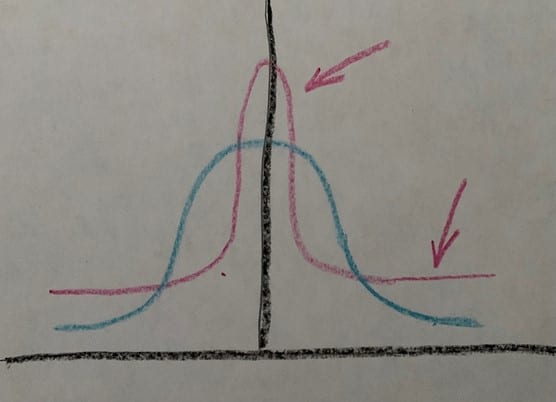
In a nutshell, there are more frequent “normal returns” (within that 1% range) than a bell curve would predict. There are also more abnormal returns than a bell curve would predict – thankfully these outliers are in both directions – there are both really good daily returns as well as really bad ones.
Geeky tidbit: How pointy the peak of the bell curve is called kurtosis – and a curve with a peakier peak and fatter tails is called leptokurtic (think “klepto-kurtic” as your mnemonic = leptokurtic returns are stealing your peace of mind with those fat tails).
The moral of the story is, most of the time the U.S. stock market is, unusually, pretty “normal”: roughly 94% of the time the daily return has been within +/- 1%. And for better and for worse, it has also been unusually unusual.
Super-sigma days
One last, extra geeky observation. One standard deviation is also called a sigma, named after the Greek letter used to represent it in equations. A move that is beyond seven standard deviations would be called a “7-sigma day.” and if market returns were normal, we would expect that to occur roughly once every 3 billion years. Not only have there been 7 sigma days, but there also have been 8-, 9-, and 10-sigma days.
To sum up: A normal daily move in the U.S. stock market is within 1% up or down. So if the Dow is at about 30,000 (like it is now), then a normal daily move is within +/- 300 points on any given day right now.
Using standard deviation with things that don’t follow a normal distribution is a square peg in a round hole problem. The math isn’t perfect, but it is all we’ve got to work with, so we’ve got to love it. Remember, if you can’t be with the one you love baby, love the one you’re with: https://www.youtube.com/watch?v=HH3ruuml-R4.
How do you balance having the life you want to enjoy today with what you’re going to need in the future? Are you doing what it takes to enter your dream retirement? TAKE OUR QUIZ to find out.
Disclaimer:
The views contained herein are not to be taken as an advice or recommendation to buy or sell any investment. Any forecasts, figures, opinions or investment techniques and strategies set out are for information purposes only, based on certain assumptions and current market conditions and are subject to change without previous notice. This material should not be relied upon by you in evaluating the merits of investing in any securities or products mentioned herein. In addition, the Investor should make an independent assessment of the legal, regulatory, tax, credit, and accounting and determine, together with their own professional advisers if any of the investments mentioned herein are suitable to their personal goals. Investors should ensure that they obtain all available relevant information before making any investment.
