
What to “Do”?
There are great disparities in our individual baskets of consumption.
Do you need a new car? Then, car prices are particularly relevant.
How about moving to a new community/new job? Then you really care about current real estate markets, both selling and buying.
The clear perception in the economy is that many items and services have gone up in price far more than even the official short-term 5%+ or so.
So the first answer, as in so many areas, is: “It depends.”
What can be said with certainty, though, is “don’t panic.”
It’s not time to shift 100% of assets to TIPS or other inflation-sensitive assets.
Reactions really should depend on personal circumstances.
Many clients think first about investment effects, such as increasing interest rates.
These may be secondary for a well-diversified portfolio, which already incorporates reasonable inflation protection.
Our answer: Utilize the Resources Claims Ratio™
Fortunately, we have a tool that helps us understand the effects of inflation on an individual’s or family’s financial circumstances.
We call it the Resources Claims Ratio™.
Halbert Hargrove’s Resources Claims Ratio™ is based on the commonsense idea that one’s economic position is based on both what one has and upon what one needs—or wants—to spend.
Neither alone is a sufficient guide; in fact, focusing too much on one side or the other can easily lead to distorted decision-making.
Our Resources Claims Ratio™ employs techniques similar to those used by defined benefit pension plan managers, who utilize a “funded ratio” to determine whether or not a given pool of capital is well funded to meet future obligations to plan beneficiaries.
It’s both easier and more difficult for pension plans to use such modeling than it is for individuals.
Easier because the math and probabilities benefit from the law of large numbers.
More difficult because those in control face many competing priorities with often improper or conflicting incentives to make good decisions.
But for individuals, the incentives are much clearer, even though tradeoffs may still be difficult.
To unpack this statement, let’s first see why we call the elements of our tool Resources and Claims, and you can be the judge of whether it seems sensible.
We much prefer using the terms resources and claims instead of assets and liabilities when analyzing someone’s current financial position and future prospects.
Neither assets nor liabilities match the common and/or legal definitions of either word. Our approach employs more descriptive words whose meaning we can clearly define.
How we define Resources and Claims
To make things a little clearer, let’s break down what we mean by Resources and Claims
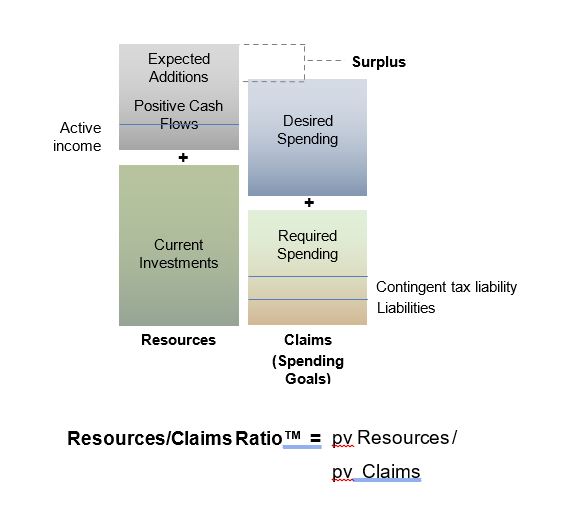
Resources
Resources include both current investment assets and future expected cash flows such as those from human capital, commercial annuity payments, and Social Security.
Social Security, for example, is not an “asset” but it has real value that can be brought to a current capital value equivalent when we discount cash flows.
In creating analytics for reporting and communication purposes, it is useful to separate cash flows relating to human capital from other payments that are life contingent or partially life contingent.
This is mostly because there are (usually) options and decisions to work, or not available.
Similarly, whether equity in a primary residence is to be taken into account in a reverse mortgage or other financial product should be addressed.
Claims
An individual’s claims include actual liabilities plus required spending for essentials such as living costs and taxes.
Some taxes are contingent in nature; they do not become payable until an appreciated asset is sold. Under current rules, the taxes may never be paid due to a stepped-up basis at death.
Claims also include desired spending—for example, spending to support family members for whom there is no legal support requirement.
One might also want to spend on charitable giving, family legacies, education, etc.
We segregate claims as “required” or “desired.”
Clearly, the motivation of a client to ensure coverage of the former is normally greater than the latter, but individuals can and do prioritize in ways that confound textbooks and, often, advisor expectations!
What does the Resources Claims Ratio™ do?
The Ratio integrates discount factors like future cash flows and mortality
One important additional element of the Resources Claims Ratio™ is the discounting of future cash flows, both in and out, to bring those values back to a present value equivalent.
Discounting and present value simply mean that a dollar one has today is worth more than a dollar to be received in the future.
A discount rate mathematically makes them equal.
Rather than using some arbitrarily fixed rate, the Resources Claims Ratio™ uses current Treasury interest rate curves.
We do so because there is a term structure in interest rates, with longer rates usually higher than shorter rates—and because we want to let the markets tell us what is available to actually equate current and future dollars.
As you’ll see below, this discounting can have different effects depending on the diverse elements that comprise a specific individual’s ratio.
One further wrinkle: We’ll use an additional discount factor based on an individual’s (or couple’s) life expectancy, i.e. a mortality discount.
While the Resources Claims Ratio™ is a very useful tool, it does not forecast the future any more than do other financial planning techniques.
It does help create a much clearer picture of one’s current financial position, but regular reviews of changing personal and environmental circumstances are needed.
Examples of Inflation Impacts
Here’s a graphic example of the Resources Claims Ratio™ followed by comments about some of the ways each element may be affected by inflation:
Future Expected Cash Flows
Are future cash flows inflation-linked or inflation-sensitive?
Social Security payments just received a 5.9% boost for 2022 due to an admittedly flawed measure of inflation.
Other types of investment income—like real estate rentals, TIPS, inflation-linked variable annuities—can move directionally, though generally not precisely, with price level changes.
Even stock dividends and equity returns overall generally do well until inflation rates accelerate.
The best offset, if it is available and one is in reasonably good health, is to continue to work even if it’s not full-time.
Human capital (payment for work in this context) supports financial, emotional, and health benefits. This is why we show active income separately.
- Current Investments
An investment portfolio may include or exclude one’s home.
Clearly, spending patterns can change dramatically depending on whether a home is paid for, or not, and whether it is in good repair and adequately insured.
Since one’s home is frequently the owner’s largest—or at least a relatively large—resource, it is important to think clearly about its role in planning. Your mortgage costs are unlikely to go up.
Other costs of homeownership will be subject to inflationary pressure, but discretionary improvements can be postponed.
Our investment portfolios typically contain a mix of asset types that react well to or even benefit from inflation, including:
- Core private real estate
- Use of shorter duration fixed income
- Alternative investments with short duration or short reset cycles to capture higher pricing
- Use of the Moving Daily Average technique in case of market reactions to increasing interest rates.
- It is unclear how equity markets will react to whatever combination of fiscal stimulus and interest rates will be in store for 2022 and beyond.
We don’t rely heavily on Treasury Inflation-Protected Securities (TIPS), since current very low-interest rates are a significant drag, and TIPS implies a sort of all-in bet on direction and intensity.
This is worth emphasizing: It is vitally important to remember that being too conservative can be very damaging for the long-term investor.
Unlike other financial planning techniques that require either a point or range estimate for portfolio returns, the Resources Claims Ratio™ assumes only a portfolio return equal to the discount rate used.
The Treasury curves used are much lower than historic equity or balanced portfolio returns, and are also considerably lower even than expected returns from elevated market prices.
3. Required Spending
Essential spending usually includes living expenses, mortgage liability payments, if any, taxes, and—of increasing worry and relevance—health care costs.
If a mortgage is still in place, a long-term fixed-rate mortgage makes an excellent inflation hedge (sort of, since local real estate prices, are generally not directly tied to overall inflation rates—but you’ve at least stabilized a major expense).
Insurance coverages have to be an area of focus, even more so in an inflationary environment to make sure they are adequate.
Always depending on individual circumstances: Are health and long-term care exposures covered as well?
For many people, it is counterintuitive that interest rate increases might be beneficial.
We know, of course, of the negative potential impact on investment portfolios.
But for many, an increasing discount rate—due to the ability to invest at higher rates—might well outweigh short-term pain.
4. Desired Spending
A key element of risk management is to not overextend commitments to the desired spending.
While one might think one could always sell that second home or boat, etc. markets and prices tend to evaporate at just the wrong point in time.
In general, though, a good understanding of one’s Resources Claims Ratio™ allows flexibility and comfort with the desired spending.
The debate about whether the “4%” Rule should really be the “3.3%” Rule does not account for individual conditions and plans.
With each regular review of the Resources Claims Ratio™ and updated planning, it’s relatively easy to see what has changed since the last review:
- Discount rates?
- Plans for spending?
- Portfolio values?
- Home equity?
Higher discount rates, for example, come from higher interest rates. While this might mean short-term declines in portfolio values, it might also permit investment in higher-earning assets to offset planned future spending.
Risk On? Risk Off?
Financial writers love to use shorthand, usually to explain stock market action after the fact.
But using “risk” in this way confuses the meaning of risk—to which we can, even if imperfectly, ascribe outcome probabilities—with uncertainty.
It is this uncertainty with which we must deal. We have tools to help: the Resources Claims Ratio™ is a powerful one. At least we can have a clearer, personalized picture of current financial reality.
Manufacturing in several countries, transportation of goods, pricing—all affected by the pandemic, by politics, by changing demographics. It seems to be pure hubris to assume we know what the new global economy will look like.
Coupled with diversification, disciplined review, and diligence in analysis, we tend to think we’ll be able to cope with whatever future(s) await us
See Part 1 of this post “Inflation in 2022”.
Disclosure:
Halbert Hargrove Global Advisors, LLC (“HH”) is an SEC registered investment adviser located in Long Beach, California. Registration does not imply a certain level of skill or training. Additional information about HH, including our registration status, fees, and services can be found at www.halberthargrove.com. This blog is provided for informational purposes only and should not be construed as personalized investment advice. It should not be construed as a solicitation to offer personal securities transactions or provide personalized investment advice. The information provided does not constitute any legal, tax or accounting advice. We recommend that you seek the advice of a qualified attorney and accountant.
The views contained herein are not to be taken as advice or a recommendation to buy or sell any investment. Any forecasts, figures, opinions or investment techniques and strategies set out are for information purposes only, based on certain assumptions and current market conditions and are subject to change without previous notice. There is no guarantee any forward-looking statement will come to pass. All opinions or views reflect the judgment of the author as of the publication date and are subject to change without notice. All information presented herein is considered to be accurate at the time of writing, but no warranty of accuracy is given and no liability in respect of any error or omission is accepted. This material should not be relied upon by you in evaluating the merits of investing in any securities or products mentioned herein. In addition, the Investor should make an independent assessment of the legal, regulatory, tax, credit, and accounting and determine, together with their own professional advisers if any of the investments mentioned herein are suitable to their personal goals. Investors should ensure that they obtain all available relevant information before making any investment. It should be noted that the value of investments and the income from them may fluctuate in accordance with market conditions and taxation agreements and investors may not get back the full amount invested. Both past performance and yield may not be a reliable guide to future performance. Any reference to a market index is included for illustrative purposes only as it is not possible to directly invest in an index.