
By David Koch, CFP®, AIF®, CFA, Senior Wealth Advisor
What a ridiculous question, right? Bigger is always better. Not so. There are several circumstances which would make a 5% return better than a 6% return.
I’ll explore three of these circumstances with you: an economic reason, a mathematical reason, and a behavioral one. While this list is not exhaustive, it should provide a means for you to begin to compare apples to oranges when evaluating investment returns.
The first is the simplest – the economic reason: Real returns vs. nominal returns
We are all familiar with inflation, the rising of prices that reduces your purchasing power. Although inflation has been quite muted over the last decade – below 2% – the prior 50 years (1970-2020) have seen an average annual inflation rate of about 4%. [1]
Inflation is so important that since 1977, the United States Federal Reserve (The Fed) actually only has two jobs. The first is to try to control unemployment, and the second is to try to control inflation. This is called their “dual mandate.” A little inflation is considered a good thing and the Fed targets a 2% inflation rate.
The average amount by which your investment goes up (or down) is called your nominal return. When you take your nominal return on your portfolio and you subtract the inflation rate, we call this the real return. This is what you have actually earned in purchasing power over the same period of time.
If you were to get a 6% return during the 25-year period 1970-1995, you would have given nearly all of it up to inflation (which averaged 5.75% per year during that period).1 Your real return would have been about 0.25%.
If you were to get a nominal 5% return during the next 25-year period, of 1995-2020, you would have achieved a real return of 2.75%.1 This may not sound like much, but in real terms that outcome is 11x better than the prior 25-year period, even though it sounds worse. This is one example when a 5% return is better than a 6% return. Few people speak in real terms, but real returns are what actually matter.
One extreme example is the best-returning stock market over the last year (10/2019-10/2020). In nominal terms, that’s been Venezuela’s Caracas stock market with a ~935% 1 year return.[2] Tragically, they experienced an estimated 10,000,000% inflation rate in 2019 alone.[3] This means that something that cost $100 Bolivar in January 2019 cost $10,000,000 Bolivar that same December. Your nominal return in that market, net of inflation, would be completely wiped out in real terms.
The second is a little mathy, but I’ll get you through it: Variance drag
I wrote a whole piece on this earlier, accompanied by charts. You can read it here, but this is the gist of it: In percentage terms, to recover from a decline in price, it takes a larger up move than the size of the move down. The wider the swings, the more it takes to keep up. For example, a 20% decline from $100 down to $80 would take a 25% up move to get you back to $100 (25% of $80 is $20). A 33% decline down to $66 would take a 50% return to get back to $100, and a 50% decline down to $50 would take a 100% increase to get you back to $100.
The long-term return of an investment can be roughly defined as the average of the period’s returns minus half the overall variance – this is called the variance drag. What we show in that piece linked above is that a 5% return with only 10% volatility does considerably better than a 5% return with 25% volatility over longer periods of time.
Risk, as defined by volatility, absolutely impacts returns – it’s just a somewhat complicated relationship and people frankly don’t talk about it much. “Hey Bob, my portfolio had such low volatility last quarter, it was great. What was the standard deviation of your portfolio?” – said no one ever.
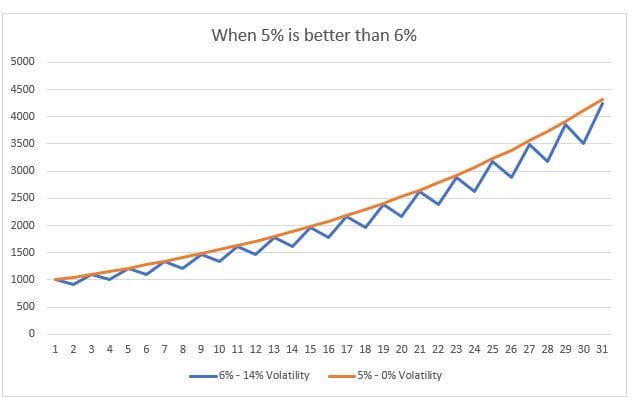
The fact is, a volatility of about 14% over the long term drags a 6% return into a worse outcome than a 5% return. The ups and downs of a volatile 6% average make it compound at a lower rate than a consistent 5% return. This is illustrated in the chart below.
The last reason is a behavioral one. But we’re not robots, this is important.
If you had the choice between having a consistent 5% return or a highly volatile 6% return, at what level of volatility would you choose the 5%? What if your 6% oscillated between up 36% and down 24% (for an average or 6%?) – this would drive most people out. What if that same investment that was going to average 6% was down 24% in the first year, would you hang onto it?
Never mind the fact that the volatility drag between those two would actually make the 5% return compound wealth better, how many times would people stick with a -24% year before they bailed? For perspective, volatility on Apple stock has been around 45%. Investors have been compensated for holding it, sure, but even Apple has seen a drop of more than 80%. It has dropped more than 50% on several occasions, and in 2000 the stock lost more than 70% of its value – in only nine months.[4]
Holding an investment through selloffs like that takes either gumption, stupidity – or you’ve been stuck in a bomb shelter like in the movie Blast from the Past. The reason the price drops like that is because – drumroll please – everyone else is selling it. When everyone else is selling, what makes you think you’re smarter than they are?
Remember, shares of stock are not created or removed when you buy and sell them. It’s called a trade because there needs to be someone on the other side. Another trader once told me, “You can’t just get out of the burning building, you have to convince someone to take your place inside.” That’s why prices can drop so quickly.
This is also why a boring 5% return may be better than a wild 6%. Never mind the math for a moment, just think of your feelings. How many times will you stick with something that loses 25% of its value before you bail? Investment professionals may be more surgical about it than individuals, but there’s a lot of hope involved that something will recover after it gets knocked down, and last I checked, hope is not a trading strategy.
How do you balance having the life you want to enjoy today with what you’re going to need in the future? Are you doing what it takes to enter your dream retirement? TAKE OUR QUIZ to find out.
Disclaimer:
The views contained herein are not to be taken as an advice or recommendation to buy or sell any investment. Any forecasts, figures, opinions or investment techniques and strategies set out are for information purposes only, based on certain assumptions and current market conditions and are subject to change without previous notice. This material should not be relied upon by you in evaluating the merits of investing in any securities or products mentioned herein. In addition, the Investor should make an independent assessment of the legal, regulatory, tax, credit, and accounting and determine, together with their own professional advisers if any of the investments mentioned herein are suitable to their personal goals. Investors should ensure that they obtain all available relevant information before making any investment.
Sources:
[1] https://fred.stlouisfed.org/series/FPCPITOTLZGUSA
[2] https://www.bloomberg.com/quote/IBVC:IND
[3] https://en.wikipedia.org/wiki/Hyperinflation_in_Venezuela#2019_inflation_estimate
